| Data processing and visualization from Chang'E-1 exploration | ||
|
1. 3D visualization of solar wind ion data from the Chang'E-1 exploration
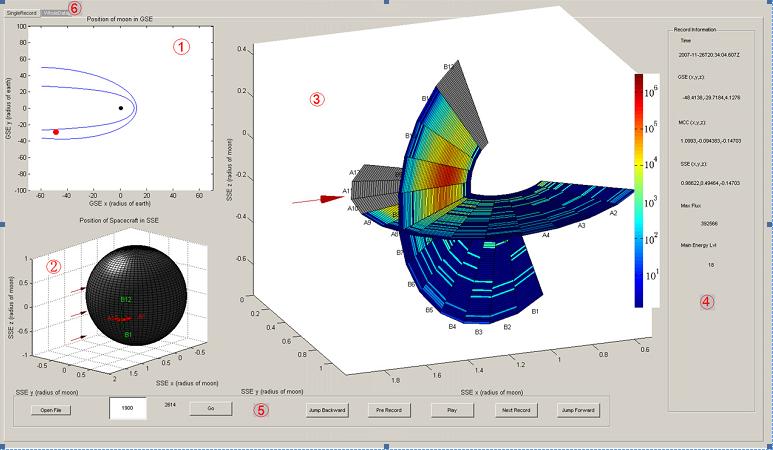
Chang'E-1 (abbreviation CE-1), China's first Moon-orbiting spacecraft launched in 2007, carried equipment called the Solar Wind Ion Detector (abbreviation SWID), which sent back tens of gigabytes of solar wind ion differential number flux data. These data are essential for furthering our under- standing of the cislunar space environment. However, to fully comprehend and analyze these data presents considerable difficulties, not only because of their huge size (57 GB), but also because of their complexity. Therefore, a new 3D visualization method is developed to give a more intuitive representation than traditional 1D and 2D visualizations, and in particular to offer a better indication of the direction of the incident ion differential number flux and the relative spatial position of CE-1 with respect to the Sun, the Earth, and the Moon. Firstly, a coordinate system named Selenocentric Solar Ecliptic (SSE) which is more suitable for our goal is chosen, and solar wind ion differential number flux vectors in SSE are calculated from Geocentric Solar Ecliptic System (GSE) and Moon Center Coordinate (MCC) coordinates of the spacecraft, and then the ion differential number flux distribution in SSE is visualized in 3D space. This visualization method is integrated into an interactive visualization analysis software tool named vtSWIDs, developed in MATLAB, which enables researchers to browse through numerous records and manipulate the visualization results in real time. The tool also provides some useful statistical analysis functions, and can be easily expanded. |
||
|
||
|
2. A 3D multiresolution lunar surface model using bicubic subdivision-surface wavelets, with interactive visualization tools
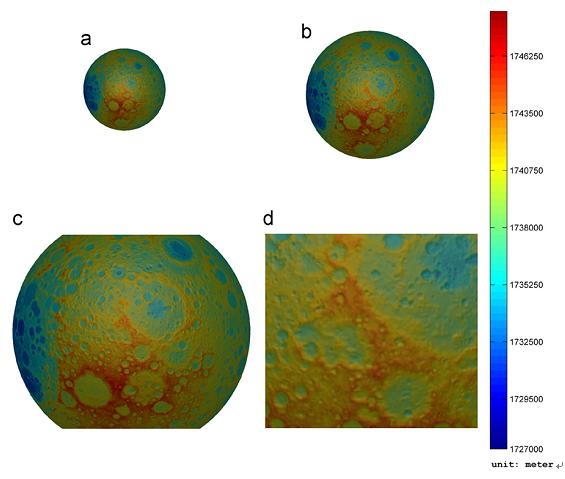
The laser altimetry(LAM) data set obtained by Chang'E-1(CE-1) contains about 8.6 million points, and how to use it to model and visualize the lunar surface is a problem. We presentsa3D, multiresolution, approximate lunar surface model based on a subdivision-surface wavelet, as well as efficient tools for rendering the three-dimensional surface at speeds approaching real-time interaction in a genera lPersonal Computer(PC) environment. The surface model is C2-continuous at nearly all points. The modeling and visualization method could be applied to most other global data sets. |
||
|
||
|
3. Visualizing the Distribution of the Energetic Particle Data Acquired by Chang'E-1 Exploration
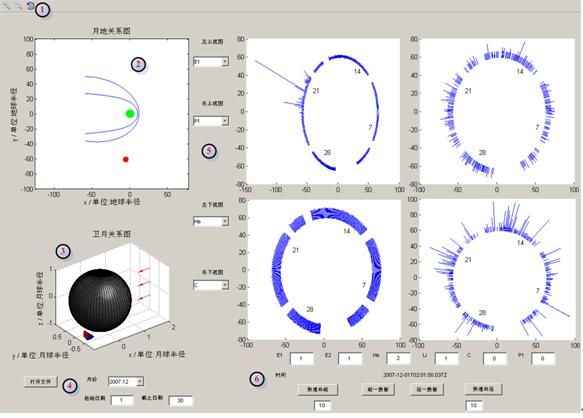
We suggest a set of visualization techniques for analyzing the distribution of large-scale energetic particle datasets acquired by Chang'E-1 explorer. Flux in data records is used to visualize time-based flux distribution; in a period of time, the energetic particle data distribution in different flux ranges is given by using histogram; the energetic particle data distribution in different flux sections on the Moon is illustrated in three-dimensional display; the average flux distribution on the Moon and the Moon-Earth-Sun angle varying distribution are visualized. We design and implement an effective computer-aided analysis system to browse and analyze datasets in different months, which significantly improves the analytical efficiency of the energetic particle data. |
||
|
||
|
4. Visualization of the Solar Wind Ion Flux Data on the Moon's Day-side and Night-side based on Chang'E-1 Exploration
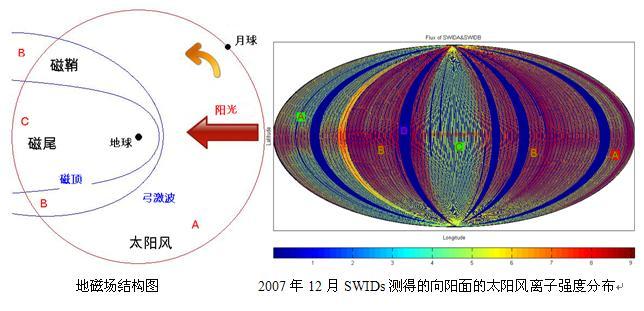
Based on the solar wind ion flux data in the cislunar space fetched by the Moon-orbiting Chang'E-1satellite, a new visualization method is developed to visualize this kind of data. First, all the data fetched in a specified period (one month at most) on the Moon's day-side or night-side are projected to an evenly divided longitude-latitude grid of the Moon surface according to the satellite's coordinates, then an average value is calculated for every grid. Finally, a map projection e.g. Hammer projection is performed on the map grid and a color scheme is chosen to represent the intensity of the ion flux. Hence an intuitive visualization representation is produced. This method can facilitate the observation of the whole distribution of solar wind flux in the cislunar space, and clearly reflect the specific distribution characters in different areas above the Moon's surface. The validity of this method has been shown by our experiments. |
||
|
||
| References: | ||
|
||
| [ ·µ»Ř ] | ||
|
|
||